You spent the week on the Mother's Day campaign. Facebook ads, an email to the list, a couple of influencer links. They all land on the same page.
Then you run a test on that page, and the new headline wins. +6%. Ship it.
Here's the part nobody looks at: that +6% is an average of very different people.
One page, three audiences
Someone who clicked a Facebook ad has never heard of you. They're skimming on a phone, half-interested, and they need to know what this is in about two seconds.
Someone who clicked your email already bought from you. They don't need the pitch. They need the offer and the button.
Someone from search typed what they wanted. They need proof you have it.
Those three people don't respond to the same headline. They shouldn't. But your test result lumps them together, and the average decides what everyone sees.
How a winner hides a loser
Here's an illustrative example (made-up numbers, but a very real pattern):
- Email visitors: the new headline converts +15% better. Short, direct, offer up front. Your loyal customers love it.
- Facebook visitors: the same headline converts 4% worse. Cold traffic needed the context you cut.
- Blended: about +6%. Looks like a clean win.
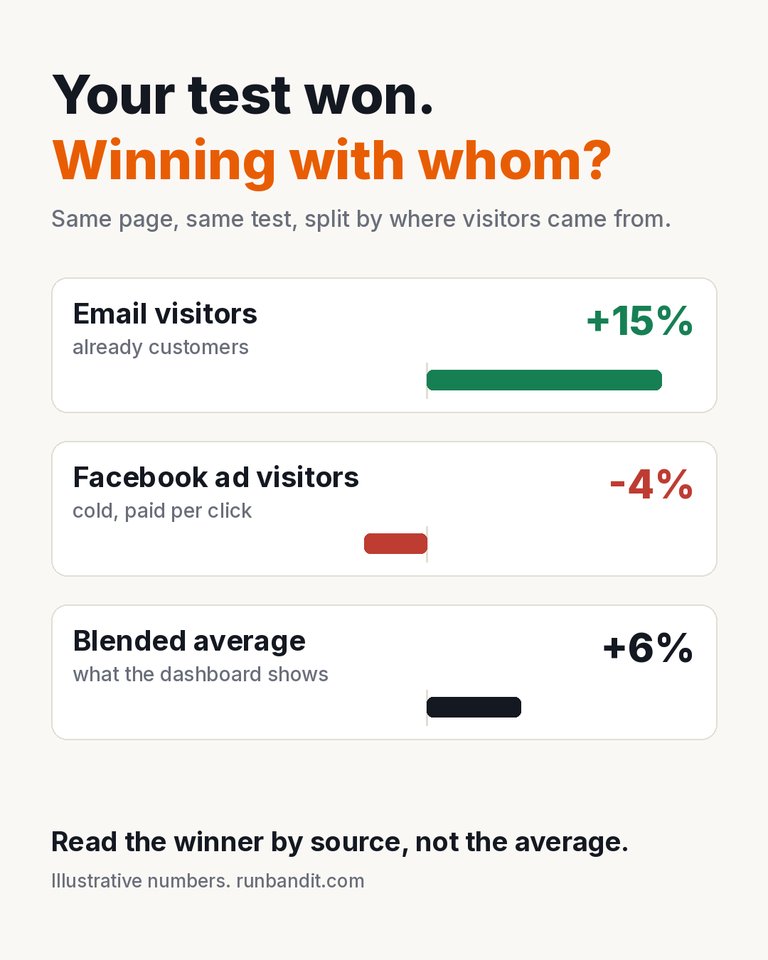
The blended +6% hides a loss on the paid traffic. Illustrative numbers.
So you ship it to 100% of traffic. Your email numbers go up. Your Facebook numbers quietly go down. And Facebook is the traffic you're paying for, per click.
Nobody notices, because the dashboard shows one number and the number went up.
This compounds the wrong way
I write a lot about how small lifts compound across a funnel. A few single-digit wins at each step turn into a double-digit gain at the end.
It works in reverse, too. If your highest-cost traffic loses a few percent at the landing page, and again at the product page, and again at checkout, you're losing more than a little conversion. You're losing return on every ad dollar, at every step, and the blended average hides all of it.
Read the winner by source
The fix isn't complicated. Before you call a winner, ask one more question: winning with whom?
- Tag your traffic. UTMs on every campaign link. If you can't tell Facebook from email, you can't tell anything.
- Look at results per source, not just in total. Did the winner win everywhere, or did one big source carry it?
- Compare versions within each source. Email visitors convert better than ad visitors no matter what you show them. That's not a signal. The signal is which version does better with the same visitors.
- Watch your paid traffic hardest. A loss on free traffic is a missed opportunity. A loss on paid traffic is a bill.
What we built for this
This is why Bandit now records where every visitor came from (UTM tags, click IDs, referrer) and shows it right on your funnel and campaign pages.
You get a source mix bar at the top: how much traffic came from Facebook, email, search, and the rest. Click a source and you see how those visitors convert, how much revenue each one brings in, and which versions win or lose with those visitors specifically. The comparison happens inside the source, so a source that just converts better overall doesn't fake a signal.
And the Campaigns page lists every campaign Bandit detects from your UTM tags, across all your funnels, so you can see which campaigns are carrying their weight without exporting anything to a spreadsheet.
You still get one winner on average. Now you also see who it's winning with.
The short version
Your test didn't run on "visitors." It ran on Facebook visitors, email subscribers, and searchers, all at once. If you only read the average, you'll eventually ship something that wins with the people who were already going to buy and loses with the people you paid to bring in.
Tag your links. Read the winner by source. Protect the traffic that costs money.
Ready to try algorithmic testing?
Stop wasting traffic on losing variants. Bandit's multi-armed bandit algorithms automatically shift traffic to your best-performing treatments in real time.
Try it on my site